Part 7 — How Continuous Biomarker Supply Makes Supply-Side Economics Operational
Every payer knows the theory: if you could see risk before claims show up, you could intervene earlier, stabilize Medical Loss Ratio (MLR), and protect margins.
𝗧𝗵𝗲 𝗿𝗲𝗮𝗹 𝗾𝘂𝗲𝘀𝘁𝗶𝗼𝗻 𝗵𝗮𝘀 𝗮𝗹𝘄𝗮𝘆𝘀 𝗯𝗲𝗲𝗻: 𝗛𝗼𝘄?
Until recently, payers didn’t have a scalable way to generate early risk visibility. Demand-side models defaulted to claims because claims were the only universal, structured data source.
That has changed.
Continuous biomarker supply data streaming directly from members’ smartphones has turned supply-side economics from concept into operating model.
𝗪𝗵𝘆 𝗘𝗮𝗿𝗹𝘆 𝗥𝗶𝘀𝗸 𝗗𝗮𝘁𝗮 𝗛𝗮𝘀 𝗔𝗹𝘄𝗮𝘆𝘀 𝗕𝗲𝗲𝗻 𝗠𝗶𝘀𝘀𝗶𝗻𝗴
- Claims lag 90–180 days.
- Labs are episodic and incomplete.
- EHRs are fragmented and provider-controlled.
- Health Risk Assessments (HRAs) rely on self-reporting and decay fast.
Plans have been flying blind on rising-risk members because they had no direct, continuous input. That’s why they defaulted to reacting after the first cost hit.
𝗦𝗺𝗮𝗿𝘁𝗽𝗵𝗼𝗻𝗲𝘀 𝗮𝘀 𝘁𝗵𝗲 𝗡𝗲𝘄 𝗦𝘂𝗽𝗽𝗹𝘆 𝗖𝗵𝗮𝗶𝗻 𝗳𝗼𝗿 𝗥𝗶𝘀𝗸 𝗗𝗮𝘁𝗮
For the first time, consumer-grade devices can generate high-fidelity biomarker data at scale. Such technologies can capture signals tied to:
- Blood pressure trends
- Heart-rate variability
- Lipid and liver function risk proxies
- Pre-diabetes, pre-hypertension, early cardiovascular stress
Members can scan in 30 seconds, with no wearable or clinic visit required.
Each scan generates 20 + metabolic and cardiovascular indicators, turning a population that was invisible into a measurable supply of future risk.
𝗠𝗮𝗸𝗶𝗻𝗴 𝘁𝗵𝗲 𝗗𝗮𝘁𝗮 𝗢𝗽𝗲𝗿𝗮𝘁𝗶𝗼𝗻𝗮𝗹 — 𝗪𝗵𝗲𝗿𝗲 𝗜𝘁 𝗙𝗶𝘁𝘀
Supply-side data only matters if it plugs into the payer machine without adding new overhead.
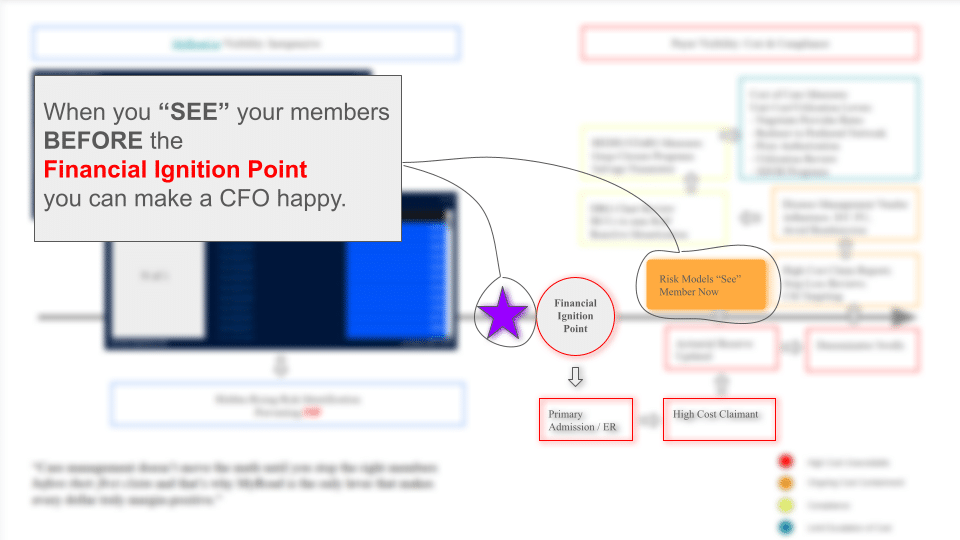
This is where the Financial Ignition Point model comes in.

Figure: On the right is today’s demand-side cost & compliance treadmill: HEDIS/Stars measures, prior auth, DRG reviews, risk models that only “see” a member after their first high-cost claim.
On the left is the supply-side model: myroad.prodjex.dev/ streaming inexpensive, real-time risk visibility months before that first claim and stopping members at the Financial Ignition Point.
“Care management doesn’t move the math until you stop the right members before their first claim — that’s why myroad.prodjex.dev/ is the only lever that makes every dollar truly margin-positive.”
Once supply-side risk data enters the system:
- Actuarial platforms see new risk before cost.
- Care management can target members at the highest ROI moment (pre-claim, pre-event).
- Stars/quality programs can preempt gaps instead of chasing them.
This is how you step off the treadmill without hiring more case managers or layering new vendors.
𝗦𝗰𝗮𝗹𝗶𝗻𝗴 𝗪𝗶𝘁𝗵𝗼𝘂𝘁 𝗡𝗲𝘄 𝗜𝗻𝗳𝗿𝗮𝘀𝘁𝗿𝘂𝗰𝘁𝘂𝗿𝗲
Traditional demand-side programs stall because they scale linearly with people and vendors.
Supply-side economics scales digitally, not manually:
- A million members can scan without a million outreach calls.
- Data feeds directly into existing actuarial and care-management platforms.
- Engagement is smaller, earlier, and far more precise.
𝗥𝗲𝘀𝘂𝗹𝘁: 𝗺𝗼𝗿𝗲 𝗺𝗮𝗿𝗴𝗶𝗻 𝗶𝗺𝗽𝗮𝗰𝘁 𝘄𝗶𝘁𝗵 𝗹𝗲𝘀𝘀 𝘄𝗼𝗿𝗸𝗳𝗼𝗿𝗰𝗲 𝘀𝘁𝗿𝗮𝗶𝗻.
Why This Changes Payer Strategy
For the first time, plans can:
- Forecast margin with leading indicators, not last year’s claims.
- Allocate resources to members most likely to cross into high-cost status.
- Shrink administrative waste by focusing outreach where it matters.
- Dominate CMS metrics (Stars, QBP, risk adjustment) because they own the earliest risk signal.
It’s not another point solution bolted to the treadmill.
It’s the engine that lets plans step off it entirely.
𝗧𝗵𝗲 𝗕𝗼𝘁𝘁𝗼𝗺 𝗟𝗶𝗻𝗲
Demand-side economics failed because it relied on lagging, provider-controlled data.
Supply-side economics is now possible because members themselves can generate the risk signals plans need, continuously, passively, and at scale.
This is how payers move from reactive cost management to proactive risk capital allocation, building predictable MLR and durable margins while improving care access and equity.